
Custom Business Analytics & Intelligence Dashboards for Indian Enterprises
Replace static Excel reports with live executive dashboards, automated KPI alerts, and custom business intelligence tools built on your actual operational data.
Quick Answer: What is a business intelligence dashboard?
A business intelligence (BI) dashboard is a real-time visual interface that pulls data from your business systems — ERP, CRM, inventory — and displays key metrics, trends, and KPIs in one centralized view. Unlike static Excel reports, BI dashboards update automatically and allow drill-down analysis.
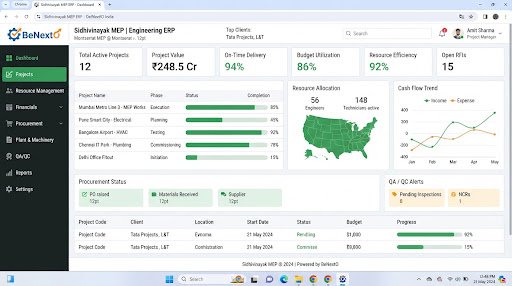
Operational Landscape Overview
Who Needs This System?
Business owners spending hours compiling Excel reports manually
Management teams making decisions on outdated weekly data
Finance teams tracking receivables and cash flow across multiple sheets
Operations managers monitoring production, delivery, and quality metrics
Common Issues Resolved
Stale Reporting
Data is always a week behind because reports are compiled manually
Fragmented Data
Sales data in CRM, financials in Tally, operations in Excel — no unified view
No Early Warnings
Critical issues (low stock, payment overdue, target shortfall) go unnoticed until too late
Functional System Modules
To match your operational requirements, possible modules we can engineer include:
Executive Dashboard
Top-level business health overview
- Revenue vs target tracking
- Department KPI cards
- Trend line charts
- Geo-based performance maps
Financial Analytics
Cash flow, invoicing, and receivables
- P&L overview
- Outstanding receivables aging
- Expense category breakdown
- GST filing summary
Operations Analytics
Production, inventory, and delivery
- Inventory turnover rates
- Production efficiency metrics
- Order fulfillment rates
- Supplier performance scoring
Example System Workflow
Connect data sources (ERP, CRM, Tally, third-party APIs)
Define KPIs, metrics, and dimensions relevant to your business
Build dashboards with role-specific views
Configure automated report scheduling
Set threshold alerts for critical KPIs
* Note: Workflows are configured and customized strictly around your business operational patterns.
Scannable Features Matrix
Real-Time Data Sync
Dashboard reflects live operational data
Purpose: Make decisions on current, not week-old, numbers
Role-Based Views
Different dashboards for CEO, Finance, Sales, Operations
Purpose: Each role sees only relevant KPIs
Automated Reports
PDF/Excel reports emailed on schedule
Purpose: Eliminate manual report compilation every Monday morning
Automation Opportunities
Auto-email daily sales summary to management
Alert on stock falling below reorder threshold
Weekly P&L report generated and distributed automatically
Real-time WhatsApp alert on payment default
Role-Based Access Controls
CEO/Owner
Executive overview — revenue, profitability, headcount
Finance Manager
Cash flow, invoicing, receivables, GST summary
Sales Manager
Pipeline, conversion rates, rep performance
Operations Manager
Production, inventory, delivery, quality metrics
Reporting & Dashboard Areas
Daily executive briefing reports
Weekly departmental performance summary
Monthly P&L and cash flow analysis
Custom ad-hoc query reports
Generic Integration Possibilities
ERP systems
Tally
CRM platforms
Google Sheets
WhatsApp alerts
Email (PDF reports)
Implementation Blueprint
01 Requirement Discovery
02 Process Flow Mapping
03 Database Architecture Planning
04 User Interface Layouts Design
05 Custom Code Engineering
06 Strict QA Verification Testing
07 System Rollout Deployment
08 User Optimization
Cost Sizing Drivers
Number of data sources to integrate
Dashboard complexity and charts
Report volume and scheduling
Real-time vs batch data refresh
Related Technical Services
Analytics & BI FAQs
Can you build dashboards on top of our existing ERP?
Yes. We connect to your existing database or ERP API to pull live data into custom dashboards without disrupting your current system.
Can we export dashboard data to Excel?
Yes. All reports can be exported to Excel/CSV on demand or scheduled for automatic email delivery.
Ready to Build Your Custom Analytics & BI?
Consult with our engineering architects in Pune. We deliver complete operational blueprints, schema diagrams, and milestone estimates.